Hi community,
We’ve been consistently experiencing high load on our Boundary RDS PostgreSQL database. The impact is clearly seen when a user opens Boundary Desktop and has to wait for 7 to 10 seconds to see a list of Targets they can connect to or a list of Sessions that are active/pending. Authorizing a new session also takes a couple of seconds and used to be immediate during the implementation phase. These waiting times are less noticeable when using Boundary CLI.
The issue is somewhat similar to the one described here, supposedly fixed by enhancements in 0.8.x and 0.9.x. We’re running 0.12.2.
The DB instance is a db.t4g.xlarge with 4 vCPUs and 16GB RAM, which I would assume to be more than enough for a production deployment based on the reference architecture that uses a db.t3.micro.
Here you can see some stats of the top SQL commands by waits (the top query is the same pointed out in the Github issue above)
and performance metrics of the instance (notice 1 vCPU is consistently at max utilization)
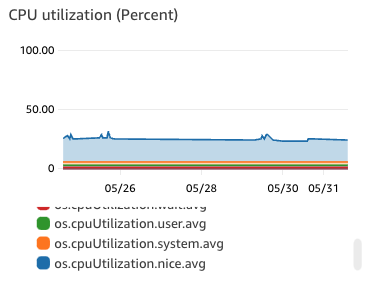
We have 3 controllers running in a single Kubernetes cluster. The workers run on 6 different clusters (3 per cluster, with a few exceptions). Both controllers and workers are exposed using Kubernetes Ingress (workers leverage an ingress-nginx feature to expose TCP ports).
At any given time no more than 20 Boundary sessions are active across all clusters (since Boundary adoption is happening slowly). This was verified with the following SQL query (not sure if my interpretation of the result is correct though):
SELECT * FROM "public"."session_state" WHERE ("state" = 'active') AND ("end_time" IS NULL)
Although the number of sessions is quite small, the number of rows in the session_connections table is quite high (160k rows) and in session_connection_states 3x as much (understandably, since it tracks 3 different states for each connection).
Some questions I have:
- Is it normal to have so many session connections? We have only been using it for a month in production. An extra piece of information: for every closed connection, the column
closed_reason shows either unknown or system error which I find quite strange.
- Is it reasonable to assume that regularly purging old connections from the
session_connection table would reduce the load on the server? What other alternatives are there? What are the downsides of doing so besides the loss of historical data?
- What else can I do to debug the high cpu utilization if what I described is completely unrelated to the symptoms I see?
Thanks,
Marco
2 Likes
Thanks for raising this @macmiranda, and thank you for including all this context. We’re looking through this now and will get back to this thread soon!
1 Like
We’ve had a chance to review this with the engineering team. Our head of product, @PPacent , has reached out to you via direct message with email addresses to contact us directly in case there is data that you don’t want to post to this thread. It would help us if you could run an explain plan for the top two queries you screen grabbed in your previous post.
To do this, you can run explain analyze and send us this output.
Thank you again for raising this and spending the time to work through the issue!
1 Like
Hi @malnick ,
I’ve run EXPLAIN ANALYZE on the 2 top queries. Here’s the result of the first one:
Update on session_connection  (cost=6465.17..6557.68 rows=11 width=50) (actual time=38.868..39.147 rows=3 loops=1)
  ->  Nested Loop  (cost=6465.17..6557.68 rows=11 width=50) (actual time=38.471..38.506 rows=3 loops=1)
        ->  HashAggregate  (cost=6464.75..6464.86 rows=11 width=40) (actual time=38.447..38.450 rows=3 loops=1)
              Group Key: (session_connection_1.public_id)::text
              Batches: 1  Memory Usage: 24kB
              ->  Nested Loop Semi Join  (cost=0.42..6464.72 rows=11 width=40) (actual time=29.184..38.434 rows=3 loops=1)
                    ->  Seq Scan on session_connection session_connection_1  (cost=0.00..6329.38 rows=16 width=20) (actual time=15.744..38.014 rows=23 loops=1)
                          Filter: ((worker_id)::text = 'w_iry3DfV7Uk'::text)
                          Rows Removed by Filter: 163607
                    ->  Index Scan using session_connection_state_connection_id_end_time_key on session_connection_state  (cost=0.42..8.45 rows=1 width=20) (actual time=0.016..0.016 rows=0 loops=23)
                          Index Cond: (((connection_id)::text = (session_connection_1.public_id)::text) AND (end_time IS NULL))
                          Filter: ((state = ANY ('{authorized,connected}'::text[])) AND (start_time < (CURRENT_TIMESTAMP - '00:00:05'::interval)))
                          Rows Removed by Filter: 1
        ->  Index Scan using session_connection_pkey on session_connection  (cost=0.42..8.44 rows=1 width=20) (actual time=0.016..0.016 rows=1 loops=3)
              Index Cond: ((public_id)::text = (session_connection_1.public_id)::text)
Planning Time: 0.793 ms
Trigger immutable_columns: time=0.474 calls=3
Trigger update_connection_state_on_closed_reason: time=0.159 calls=3
Trigger update_time_column: time=0.034 calls=3
Trigger update_version_column: time=0.041 calls=3
Trigger wh_update_session_connection: time=0.688 calls=3
Execution Time: 40.105 ms
And the second:
Limit  (cost=1002.40..6147.94 rows=1 width=253) (actual time=12.244..13.726 rows=1 loops=1)
  ->  Nested Loop Left Join  (cost=1002.40..6147.93 rows=1 width=253) (actual time=12.243..13.724 rows=1 loops=1)
        Join Filter: ((w.public_id)::text = (session_connection.worker_id)::text)
        CTE worker_config_tags
          ->  GroupAggregate  (cost=1.71..2.26 rows=22 width=59) (actual time=0.044..0.082 rows=22 loops=1)
                Group Key: ct_1.worker_id, ct_1.source
                ->  Sort  (cost=1.71..1.77 rows=22 width=49) (actual time=0.031..0.034 rows=22 loops=1)
                      Sort Key: ct_1.worker_id, ct_1.source
                      Sort Method: quicksort  Memory: 27kB
                      ->  Seq Scan on server_worker_tag ct_1  (cost=0.00..1.22 rows=22 width=49) (actual time=0.007..0.010 rows=22 loops=1)
        ->  Nested Loop Left Join  (cost=0.14..9.28 rows=1 width=245) (actual time=0.106..0.108 rows=1 loops=1)
              Join Filter: ((w.public_id)::text = (ct.worker_id)::text)
              ->  Nested Loop Left Join  (cost=0.14..8.72 rows=1 width=213) (actual time=0.103..0.104 rows=1 loops=1)
                    Join Filter: ((w.public_id)::text = (wt.worker_id)::text)
                    ->  Index Scan using server_worker_pkey on server_worker w  (cost=0.14..8.15 rows=1 width=181) (actual time=0.012..0.012 rows=1 loops=1)
                          Index Cond: ((public_id)::text = 'w_iry3DfV7Uk'::text)
                    ->  CTE Scan on worker_config_tags wt  (cost=0.00..0.55 rows=1 width=64) (actual time=0.090..0.090 rows=0 loops=1)
                          Filter: (((worker_id)::text = 'w_iry3DfV7Uk'::text) AND (source = 'api'::text))
                          Rows Removed by Filter: 22
              ->  CTE Scan on worker_config_tags ct  (cost=0.00..0.55 rows=1 width=64) (actual time=0.001..0.002 rows=1 loops=1)
                    Filter: (((worker_id)::text = 'w_iry3DfV7Uk'::text) AND (source = 'configuration'::text))
                    Rows Removed by Filter: 8
        ->  GroupAggregate  (cost=1000.00..6136.36 rows=1 width=21) (actual time=12.133..13.610 rows=0 loops=1)
              Group Key: session_connection.worker_id
              ->  Gather  (cost=1000.00..6136.35 rows=1 width=13) (actual time=12.132..13.608 rows=0 loops=1)
                    Workers Planned: 2
                    Workers Launched: 2
                    ->  Parallel Seq Scan on session_connection  (cost=0.00..5136.25 rows=1 width=13) (actual time=9.012..9.012 rows=0 loops=3)
                          Filter: ((closed_reason IS NULL) AND ((worker_id)::text = 'w_iry3DfV7Uk'::text))
                          Rows Removed by Filter: 54544
Planning Time: 0.398 ms
Execution Time: 13.808 ms
Please note that I had to replace the variables ($1,$2,$3,…) with actual values which I chose at will.
I will reach out to you guys via e-mail as well. Thanks for the quick response.
Hi @macmiranda, would you mind creating an issue on GitHub for this so we can track it? It will also allow me to reference it when I open the PR with the fix.
Thanks
1 Like
Will do, shortly. Thanks for your your time today.
1 Like
@mgaffney
Here is the link to the issue on Github.
Thanks for all of your help, @macmiranda. I merged PR 3283 which contains the fix.

