Hi there,
We ended up with a workspace that manages around 10’000 resources. As expected, our terraform plan became super slow.
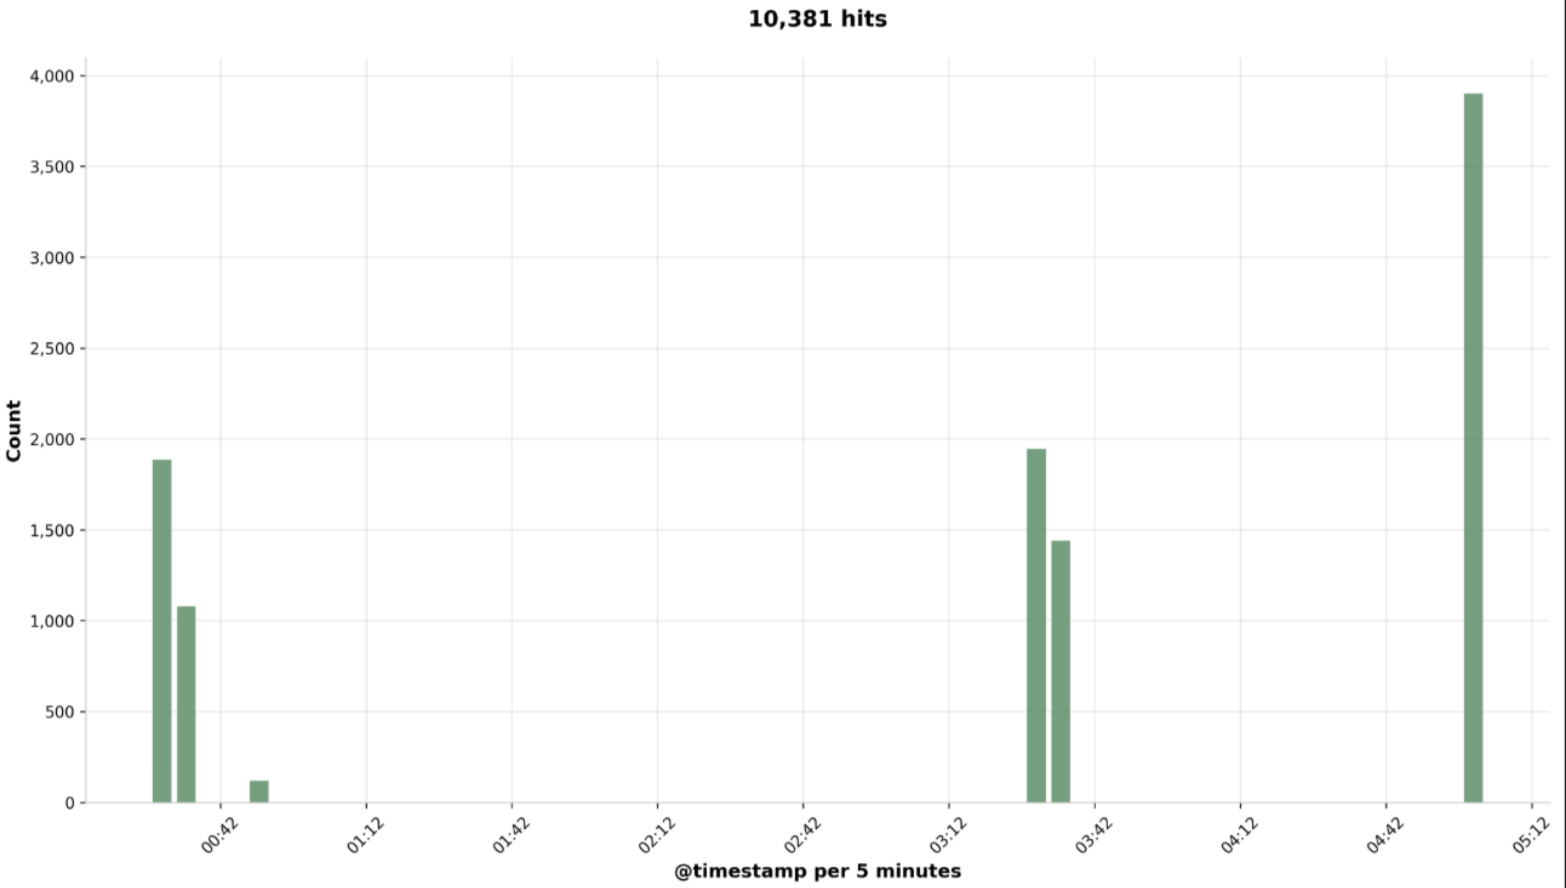
However, my question is about a strange call pattern. When we looked at the trace logs, we noticed that, instead of sending all requests in a manner consistently bounded by parallelism = 10, there were three groups of API calls that together added up to approximately 10,000 (which we confirmed by tracking their timings in our backend telemetry). For context: we’re using the TF Provider for Confluent, which utilizes an HTTP client that automatically retries up to four times, but none of our requests returned a 429.
Is it possible to explain this unusual API call pattern by the way Terraform walks its dependency graph (as described in Dependency Graph | Terraform | HashiCorp Developer)? It seems that Terraform starts with a first group of API calls, then traverses the graph, executes a second group of API calls, and repeats this process—resulting in gaps between these groups. Could these gaps also be influenced by resource constraints on the machine where we’re running terraform plan?
To walk the graph, a standard depth-first traversal is done. Graph walking is done in parallel: a node is walked as soon as all of its dependencies are walked.
The amount of parallelism is limited using a semaphore to prevent too many concurrent operations from overwhelming the resources of the machine running Terraform. By default, up to 10 nodes in the graph will be processed concurrently. This number can be set using the -parallelism flag on the plan, apply, and destroy commands.
We’re in the process of refactoring our Terraform workspace to create multiple workspaces, so that every subsequent resource update or Terraform plan would impact only a fraction of the 10,000 resources.
However, what would you recommend in the short term to unblock this extremely slow (5-hour) Terraform plan? Does increasing CPU and memory, as specified in the discussion at err="rpc error: code = Unavailable desc = transport is closing" · Issue #16073 · hashicorp/terraform-provider-aws · GitHub, make sense, as we could see a similar error in our logs? Would decreasing the value of the parallelism flag (e.g., terraform plan -parallelism=5) be helpful as well? There’s also the possibility that this could slow down the rate of API requests. However, it might still be worth trying if resource constraints are the main bottleneck.
Note: please find all pictures and links in the first comment, as I couldn’t attach them all here as a new user due to some restrictions.
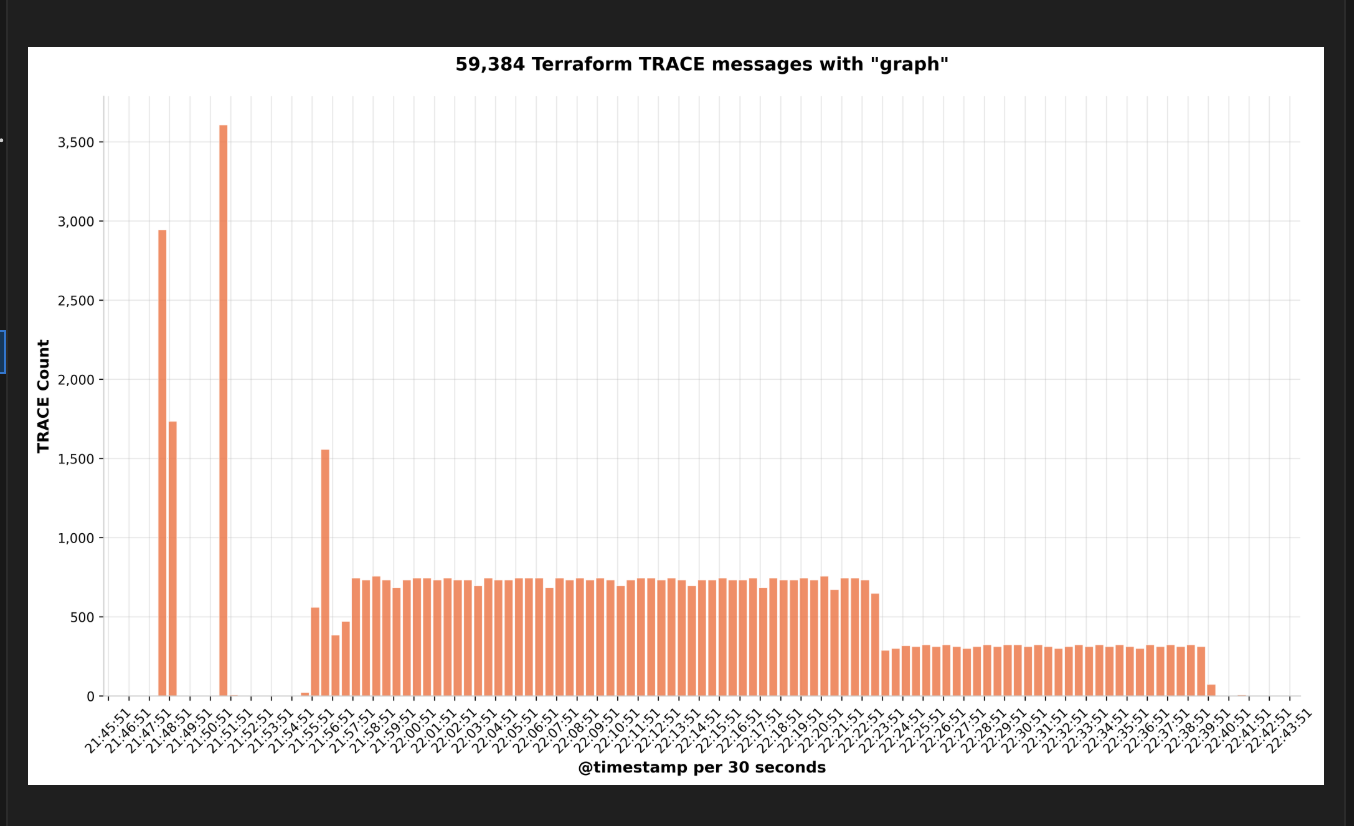
Here’s an example of a “graph” message we can see:
[2025-07-16T21:57:51.956000] 2025-07-16T21:57:50.116Z [TRACE] Executing graph transform *terraform.OrphanResourceInstanceCountTransformer
[2025-07-16T21:57:51.956000] 2025-07-16T21:57:50.116Z [TRACE] Completed graph transform *terraform.OrphanResourceInstanceCountTransformer (no changes)
[2025-07-16T21:57:51.956000] 2025-07-16T21:57:50.116Z [TRACE] Executing graph transform *terraform.AttachStateTransformer
[2025-07-16T21:57:51.956000] 2025-07-16T21:57:50.116Z [TRACE] NodeAbstractResourceInstance.AttachResourceState for module.foo["bar"].confluent_kafka_acl.app_consumer
[2025-07-16T21:57:51.956000] 2025-07-16T21:57:50.116Z [TRACE] Completed graph transform *terraform.AttachStateTransformer (no changes)
[2025-07-16T21:57:51.956000] 2025-07-16T21:57:50.116Z [TRACE] Executing graph transform *terraform.TargetsTransformer
[2025-07-16T21:57:51.956000] 2025-07-16T21:57:50.116Z [TRACE] Completed graph transform *terraform.TargetsTransformer (no changes)
[2025-07-16T21:57:51.956000] 2025-07-16T21:57:50.116Z [TRACE] Executing graph transform *terraform.ReferenceTransformer
[2025-07-16T21:57:51.956000] 2025-07-16T21:57:50.116Z [DEBUG] ReferenceTransformer: "module.foo["bar"].confluent_kafka_acl.app_consumer" references: []
[2025-07-16T21:57:51.956000] 2025-07-16T21:57:50.116Z [TRACE] Completed graph transform *terraform.ReferenceTransformer (no changes)
[2025-07-16T21:57:51.956000] 2025-07-16T21:57:50.116Z [TRACE] Executing graph transform *terraform.RootTransformer
[2025-07-16T21:57:51.956000] 2025-07-16T21:57:50.116Z [TRACE] Completed graph transform *terraform.RootTransformer with new graph:
[2025-07-16T21:57:51.956000] "module.foo["bar"].confluent_kafka_acl.app_consumer" - *terraform.NodePlannableResourceInstance
[2025-07-16T21:57:51.956000] root - terraform.graphNodeRoot
Hi @linouk23,
It is certainly possible that Terraform is making all those calls in the 5-10 min bursts shown in the graph, while doing some other processing in between. While 10k resource instances on it’s own isn’t a necessarily problem if you are willing to wait for all the API calls required, it is very easy for that many resources in a configuration to create dependency graphs with millions of edges which take exponential time to process.
The graph messages you see aren’t really indicative of anything, the trace logging around graph building is very verbose (though less so in next release) so there will be lots of messages for lots of resources. You’ve also linked to some other random situations which caused Terraform to take more time than expected, but it’s not really possible to evaluate whether any of those apply here without some example to analyze.
The first thing I would try is to see if the latest build (terraform_1.13.0-beta1 right now) help at all. It includes some performance improvements specifically for large configurations. If you are using something older than v1.12 there are even more performance improvements you may be missing.
The root cause turned out to be an import block and the terraform behavior of evaluating both sides of a ternary expression:
import {
  for_each = var.flag ? { ...some expression evaluating non-empty... } : {}
  …
}
Even when var.flag was false, terraform still evaluated the imports for the non-empty expression, resulting in the long plan times.
Changing the block to
import {
  for_each = { ...expression... if var.flag }
  ...
}
reverted the long plan times when var.flag is false.